
Arcadia Finance conducted a 2025 national survey to understand how South Africans are managing their finances amid ongoing economic uncertainty. The results reveal how households are coping with rising living costs, high interest rates and job market challenges. This study looks at how people perceive their current financial situation, the choices guiding their daily decisions and the broader factors shaping their economic outlook.
Based on a survey of 112 respondents from different backgrounds, the findings provide valuable insight into financial satisfaction, spending habits, and expectations for the year ahead. All participants completed the survey towards the end of September 2022.
Key areas of focus include how much income remains after essential expenses, perceptions of government financial management, and shifts in financial circumstances compared to the previous year. The research also explores budgeting habits, debt levels, and the steps households are taking to improve their financial stability.
This report presents an updated picture of how South African households are adapting to a difficult economic environment. It highlights both the pressures families face and the resilience that continues to shape the nation’s financial landscape.
Respondents were allowed to skip questions if they preferred, which means total responses may not always add up to 100 percent. This approach helps ensure an honest reflection of people’s willingness to share details about their financial situations while maintaining a respectful and inclusive survey environment.

Age distribution of respondents
The age distribution shows that 6% of respondents are under 25, 29% are between 25 and 34, and the majority, 40%, are aged 35 to 44, representing South Africans in their prime working years. A further 21% are aged 45 to 54, and 8% are 55 or older. Overall, most participants fall within the 25 to 50 age range, reflecting the realities of financially active adults balancing work, family, and debt amid ongoing economic pressures.

Gender of Respondents
Around 65% of respondents identify as women, 34% as men, and 1% selected “Other / I don’t want to answer.” This shows a clear female majority, suggesting that women were more engaged in the 2025 Arcadia Finance survey. The strong female representation may reflect women’s increasing role in managing household finances and their active interest in improving financial stability within South African families.

Type of Housing of Respondents
More than 53% of respondents live in rented apartments, making renting the most common form of housing. Around 34% own their own homes, 6% live in a spouse’s apartment, and 5% occupy right-of-occupancy or employee housing, while 3% own apartments. This shows that homeownership remains challenging for many South Africans, with most still dependent on rental housing due to high property prices and stricter lending conditions.

Current Employment Status
Most respondents are in permanent employment (72%), with smaller percentages in temporary work (8%), entrepreneurship (7%), unemployment (7%), pension (5%), and study (1%). Among the active labour force, the employment rate is 87%, while the unemployment rate stands at around 7.5%. Of those employed, 17% are in non-permanent or self-employed roles, and 8% are entrepreneurs, reflecting a modest but notable entrepreneurial segment within a predominantly salaried workforce.
Monthly Income of the Sample After TAX
Most respondents fall within the lower- to middle-income range, with 28% earning between R5,000 and R9,999 per month and 19% earning between R10,000 and R14,999. Only 12% earn above R30,000, while 14% earn below R5,000, likely reflecting part-time or informal workers. The average monthly income is around R13,800, with a median of R9,500, showing that while a few respondents earn significantly more, most have modest take-home pay after tax.
Comparison: 2024 vs 2025 Arcadia Finance Surveys
| Category | 2024 Highlights | 2025 Highlights | Key Change / Insight |
|---|---|---|---|
| Age Distribution of Respondents | 12% under 30; 60% aged 30–50; 24% aged 51–65; 4% 65+ | 6% under 25; 69% aged 25–44; 21% aged 45–54; 8% 55+ | Slightly older sample with fewer young participants and more in mid-career age group |
| Gender of Respondents | 51% men, 48% women, 1% other | 34% men, 65% women, 1% other | Strong rise in female participation, suggesting greater engagement in financial matters |
| Type of Housing of Respondents | 41% rent; 36% own; 8% spouse’s; 7% right-of-occupancy; 4% employee/owned flats | 53% rent; 34% own; 6% spouse’s; 6% right-of-occupancy or employee housing; 3% own flats | Clear increase in renting, showing growing affordability and lending challenges |
| Current Employment Status | 79% permanent; 5% temporary; 5% entrepreneurs; 3% unemployed; 6% pensioners/students | 72% permanent; 8% temporary; 7% entrepreneurs; 7% unemployed; 6% pensioners/students | Slight fall in job stability and rise in entrepreneurship and unemployment |
| Monthly Income (After Tax) | Most between R3,500–R10,000; average R13,200; median R9,000 | Most between R5,000–R15,000; average R13,800; median R9,500 | Slight increase in income, but higher inequality with more low and high earners |
Compared with 2024, the 2025 results show a more female and mid-career respondent group, a small drop in permanent jobs, and a notable shift toward renting. Income levels improved slightly, but rising living costs and unstable employment continue to define South Africans’ financial reality.
How Satisfied Are Respondents With Their Financial Situation?
How Satisfied Are Respondents With Their Financial Situation?
Economic pressures in 2025 continue to weigh heavily on South African households. Despite signs of gradual recovery since the pandemic, rising food prices, elevated interest rates, and slow wage growth have kept many families under financial strain. These conditions have shaped how people view their own financial wellbeing and their confidence in broader economic management.
This section examines how respondents rate their satisfaction with:
- How satisfied are you with your own financial situation?
- How satisfied are you with the government’s handling of economic matters?
Their answers offer insight into the financial resilience, sentiment, and trust levels shaping household decisions in 2025.
How Satisfied Are You With Your Personal Financial Situation?
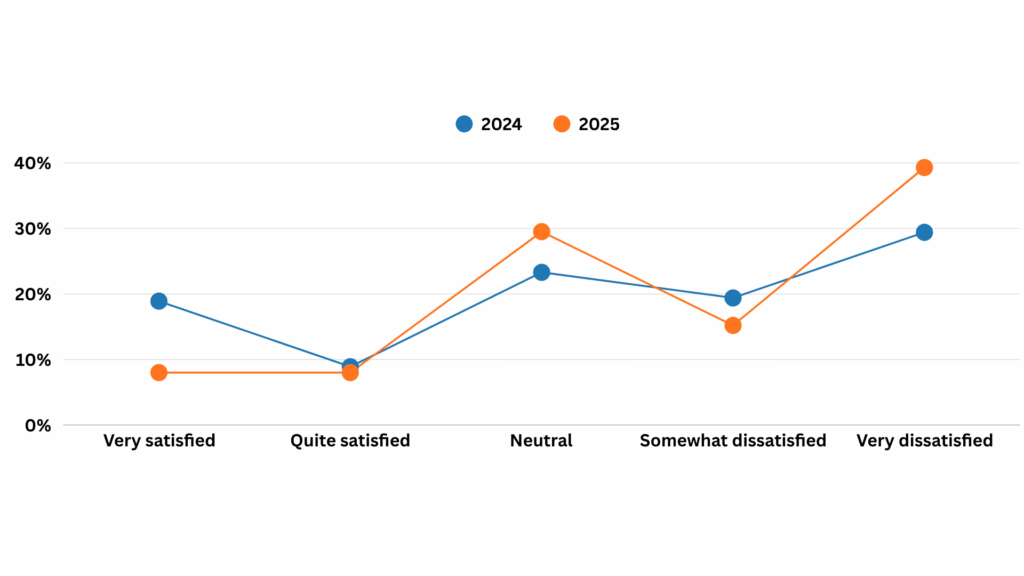
The results reveal that a significant proportion of respondents are unhappy with their financial situation. A majority of 54.5% expressed dissatisfaction, including 39.3% who are very dissatisfied and 15.2% somewhat dissatisfied, indicating widespread financial strain or insecurity. Only 16.1% reported being satisfied, split evenly between 8% who are very satisfied and 8% who are quite satisfied, suggesting that few feel financially stable or content. Meanwhile, 29.5% remained neutral, reflecting uncertainty or mixed feelings about their finances. Overall, the findings highlight a predominantly negative outlook, with most individuals experiencing varying levels of financial dissatisfaction and relatively few expressing confidence or satisfaction in their financial circumstances.
Personal financial satisfaction: 2024 vs 2025
| Category | 2024 | 2025 | Change (percentage points) |
|---|---|---|---|
| Very satisfied | 18.9% | 8.0% | −10.9 |
| Quite satisfied | 8.9% | 8.0% | −0.9 |
| Total satisfied | 27.8% | 16.1% | −11.7 |
| Neutral | 23.3% | 29.5% | +6.2 |
| Somewhat dissatisfied | 19.4% | 15.2% | −4.2 |
| Very dissatisfied | 29.4% | 39.3% | +9.9 |
| Total dissatisfied | 48.8% | 54.5% | +5.7 |
What changed: Overall satisfaction with personal finances declined sharply from 2024 to 2025. The percentage of satisfied respondents fell from 27.8% to 16.1%, mainly due to a steep drop in those who were very satisfied, which decreased by 10.9 points to 8.0%. At the same time, neutral responses increased by 6.2 points, suggesting growing uncertainty about financial wellbeing. Dissatisfaction rose from 48.8% to 54.5%, driven by a notable jump in the very dissatisfied group, which climbed by 9.9 points to 39.3%, while somewhat dissatisfied declined slightly. In short, more people have shifted from mild to strong dissatisfaction, widening the gap between satisfied and dissatisfied respondents from 21 points in 2024 to 38 points in 2025, underscoring a clear decline in financial sentiment.
Is the Government’s Economic Management Successful?
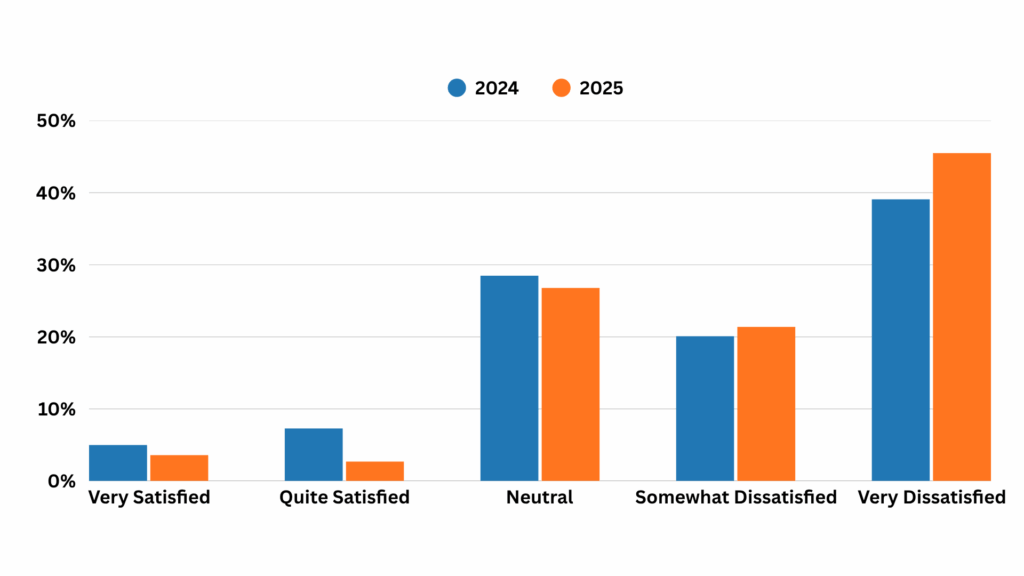
Sentiment towards the government’s handling of the economy is decisively negative. 45.5% are very dissatisfied and 21.4% are somewhat dissatisfied, totalling 66.9% dissatisfied. A further 26.8% are neutral, while only 2.7% are quite satisfied and 3.6% very satisfied, giving just 6.3% satisfied overall. The mode is Very dissatisfied, the median is Somewhat dissatisfied, and the mean score is 1.97 out of 5.
Taken together, the results point to broad discontent with economic management and only isolated pockets of approval. The large neutral percentage suggests some respondents are withholding judgement or feel mixed, but the balance of opinion leans strongly towards dissatisfaction, signalling low confidence and a potential credibility gap for current economic policy.
How Have Consumers’ Financial Resources Changed?
Responses point to stagnant or deteriorating household finances. Most people feel unhappy with their own situation, only a small percentage feel content, and a sizeable group sits on the fence, suggesting uncertainty or mixed experiences. Confidence in the broader economic backdrop is also weak, which reinforces the sense that budgets are under strain and purchasing power is being squeezed. Together, these signals imply tighter day-to-day spending, pressure on savings, and heightened sensitivity to shocks, with likely drivers including slow income growth, rising living costs, debt obligations, and concerns about job stability.
How Much Money Is Left to Spend After Essential Expenses Each Month?
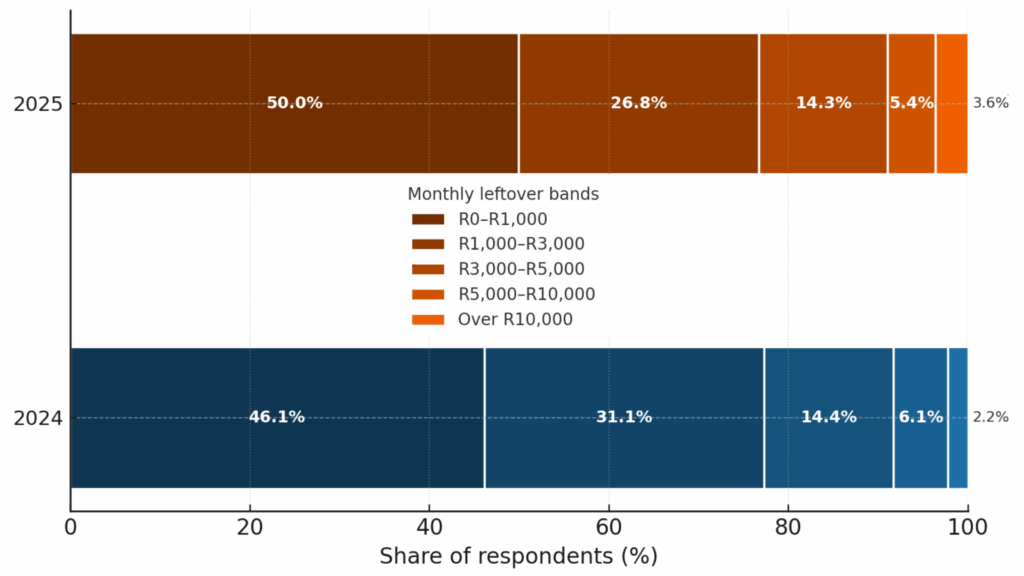
This question looked at how much money people have left after paying for essentials, to gauge day-to-day breathing room. The pattern is clear. About half of respondents have only R0 to R1,000 left each month (50.0%), and roughly another quarter sit between R1,000 and R3,000 (26.8%). In total, about 76.8% have R3,000 or less to work with after bills.
Smaller groups report R3,000 to R5,000 (14.3%), R5,000 to R10,000 (5.4%), and over R10,000 (3.6%). Using band mid-points, the average leftover is around R2,200, with the middle of the sample falling in the R1,000 to R3,000 band. In plain terms, most people have very little spare cash each month, and only a small minority enjoy meaningful financial flexibility.
Budgets remain tight with only small shifts year on year. Half now report R1,000 or less left each month, and about three in four have R3,000 or less. Only about one in eleven have more than R5,000. Using band mid-points to get a rough average, leftover money is about R2,160 in 2024 and R2,200 in 2025, so the typical amount is broadly flat, with a slight lift. The overall picture is stability at tight levels, with a small nudge toward the very lowest band and a modest rise in the highest band.
What Proportion of Your Income Goes to Essential Expenditure Compared to Other Expenses?
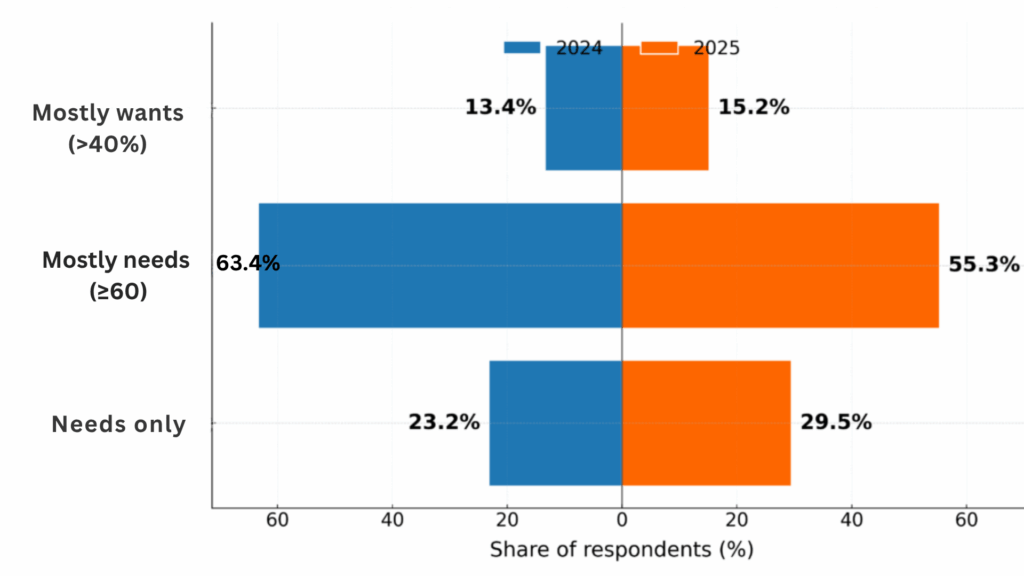
Most respondents channel the bulk of their income into essentials. 31.3% report an 80% needs / 20% wants split, 24.1% allocate 60% to needs, and a further 29.5% say 100% of their income goes to needs with nothing left for wants. Taken together, this means about 85% of the sample devote at least 60% of their income to necessities.
Only small minorities spend more on wants than needs. 8.9% report 40% needs / 60% wants, and 6.3% say 20% needs / 80% wants. Overall, the distribution points to tight budgets and limited spending flexibility for most households, with the typical pattern sitting around 80% needs and 20% wants.
Budgets still lean heavily towards essentials, but 2025 shows a small shift to the extreme. The percentage saying every rand goes to needs rose by 6.3 points, while the large 80/20 group shrank by 8.3 points. Those allocating at least 60% to needs slipped from 86.6% in 2024 to 84.9% in 2025. People spending more on wants than needs rose a little from 13.4% to 15.2%.
How Much Money Is Left for Your Household to Spend Each Month After Essential Expenses Compared to a Year Ago?
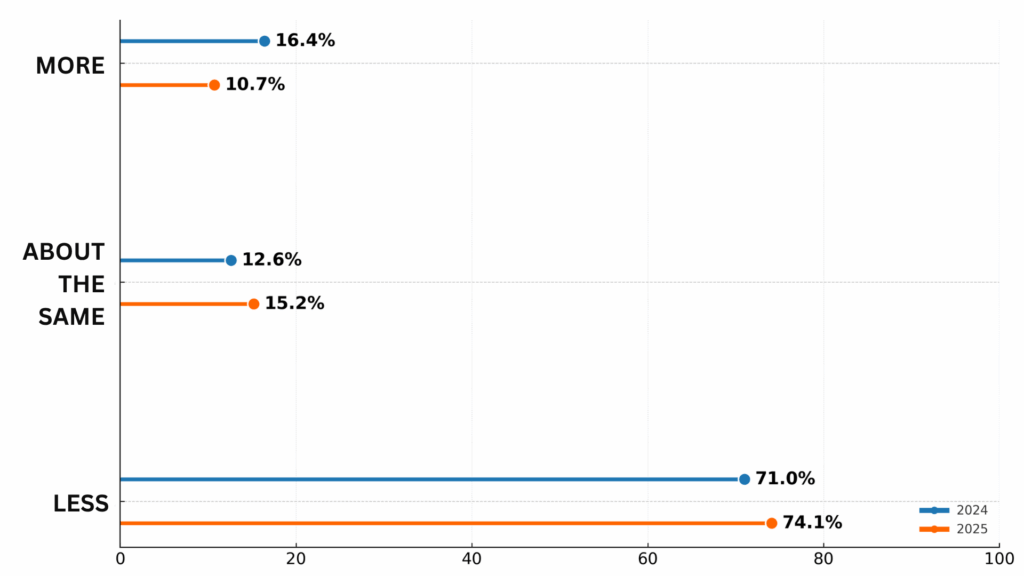
Out of 112 responses, 74.1% say they have less left after essentials than a year ago, 15.2% report about the same, and only 10.7% have more. That’s a net −63 percentage-point balance (more “less” minus “more”), pointing to a broad squeeze in monthly breathing room.
In plain terms, roughly three in four people feel worse off, one in seven are unchanged, and about one in ten are better off. The distribution is clearly tilted towards shrinking disposable income, consistent with tight household budgets and limited flexibility.
Have You Had to Change Your Household Budget in the Last 6 Months?
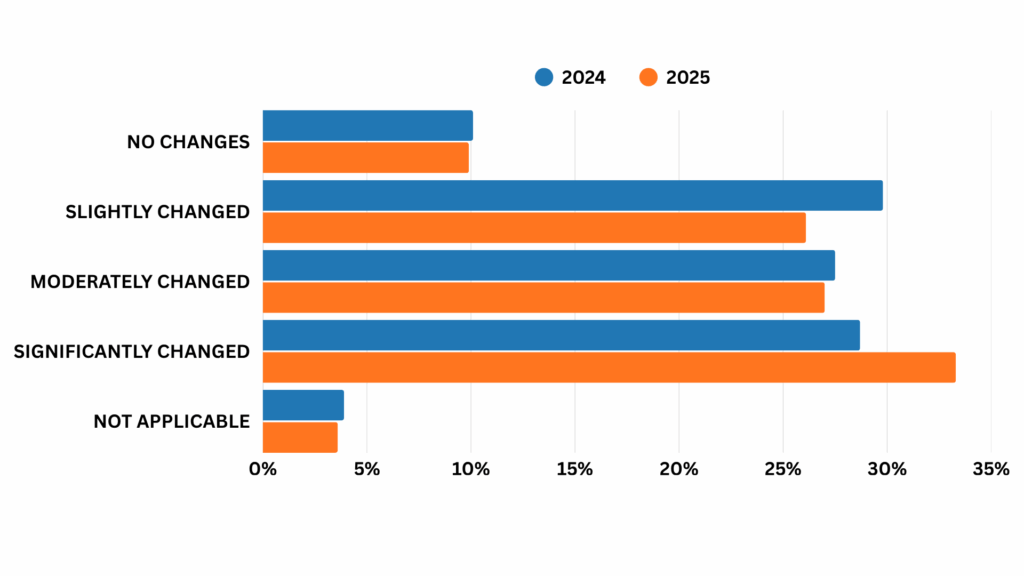
The survey points to widespread adjustment. Out of 112 responses, 86.5% say they changed their budget in the past six months, split into 33.3% significantly, 27.0% moderately, and 26.1% slightly. Only 9.9% report no changes, while 3.6% say the question is not applicable. The most common answer is significantly changed, the midpoint of the sample is moderately changed, and 60.4% report at least a moderate shift. On a 0 to 3 scale, where 0 is no change and 3 is significant change, the average sits at 1.87, which leans closer to moderate than slight.
Taken together, the findings suggest many households are trimming non-essentials, renegotiating bills, delaying big purchases, or reshuffling spending to cover rising costs. A small minority have managed to hold steady, likely due to more stable incomes or stronger buffers. For most, however, the last six months have required active budgeting and trade-offs to keep monthly finances in balance.
The percentage reporting any change is essentially flat year on year, but the intensity of change has shifted. In 2024 the most common answer was slightly changed. In 2025 the most common answer is significantly changed, up 4.6 points to 33.3 percent, while slightly changed falls by 3.7 points. The proportion making at least a moderate change rises by 4.2 points to 60.4 percent.
Expectations for the Future
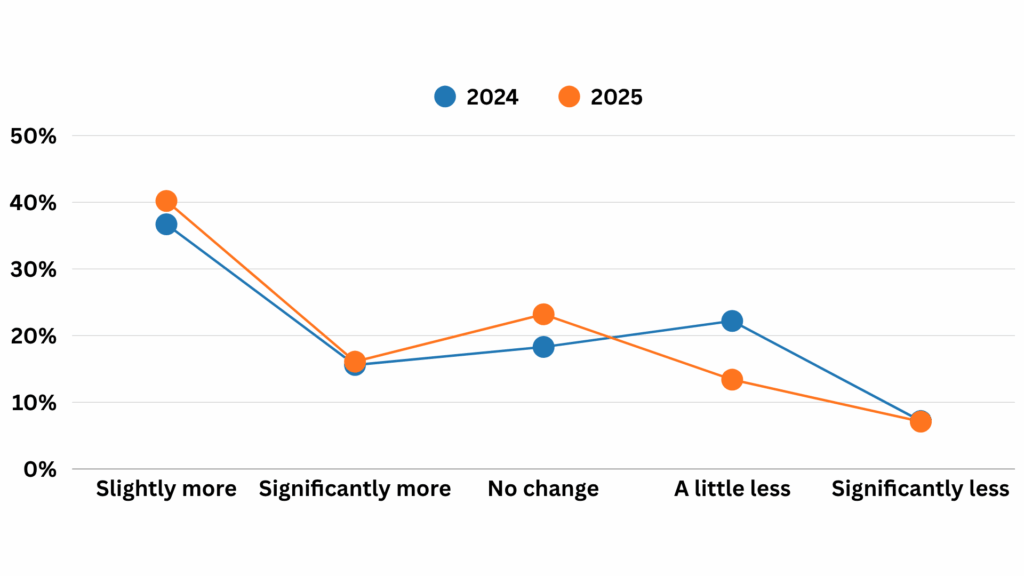
Most people are cautiously optimistic about the year ahead. 56.3% expect to have more money left after essentials, mostly a small bump (40.2% slightly more) with some expecting a bigger rise (16.1% significantly more). 23.2% think things will stay about the same. 20.5% expect to have less to work with (13.4% a little less, 7.1% significantly less). Put simply, for every person who expects their spare money to shrink, roughly three expect it to grow.
This points to hopes of modest relief rather than a windfall. Many are likely banking on small pay increases, steadier work, or a bit of easing in prices. At the same time, about one in five still see tighter months ahead, which fits with worries about rising costs, debt repayments, and uneven income. A quarter expecting no change suggests a sizeable group who feel their budgets are already stretched and do not see much movement either way.
Optimism firmed up from 2024 to 2025. The percentage expecting more money left each month rose by 4 points to 56.3%, while those expecting less fell by 8.9 points to 20.5%. Most of the improvement comes from fewer people saying a little less, which dropped sharply. Expectations of significantly more or significantly less are almost unchanged, so the shift is mainly from mild pessimism to either slightly more or no change.
Find out more about why loan interest rates go up and how you can plan ahead to stay financially secure.
Most Popular Financial Products Now and in the Near Future
In addition to assessing overall economic sentiment, the 2025 survey explores how South Africans are engaging with financial products and services. These insights help reveal how changing economic conditions are shaping consumer borrowing, saving, and investment behaviour. Economic uncertainty often influences decision-making, with many households and businesses approaching credit cautiously, even though responsible borrowing and investment remain vital for long-term growth and financial recovery.
This section examines how respondents currently use financial products and what they plan to use in the coming year. Specifically, it looks at:
- Do you currently have loans or debts? If so, what types?
- Are you holding any unsecured loans? If yes, which types?
- Have you used any financial products in the past 6 months? If so, which ones?
- Are you considering taking out an unsecured loan in the next 12 months due to your financial situation?
What Types of Loans Do Consumers Currently Have?
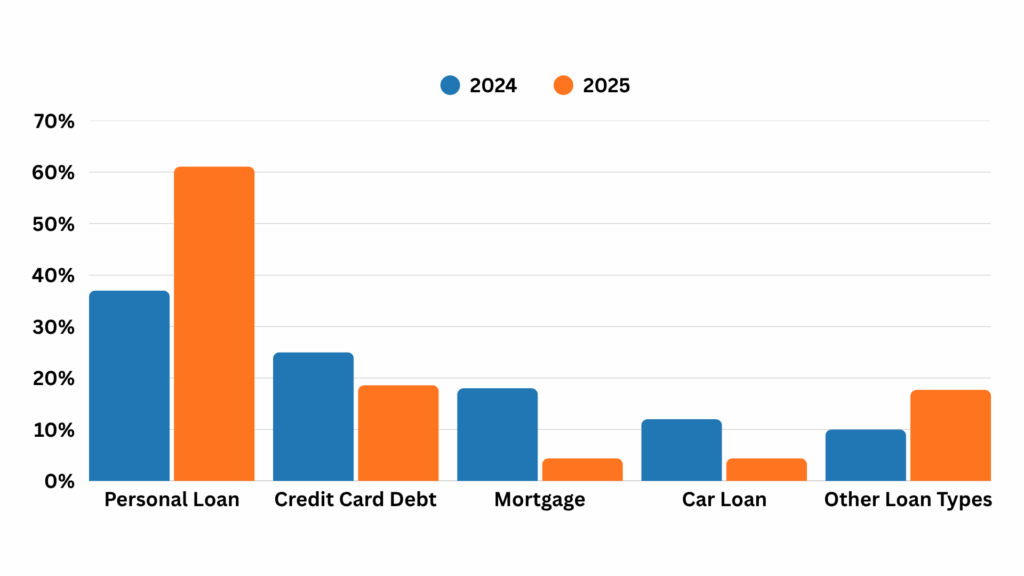
The survey shows a broad mix of borrowing, with most respondents using at least one form of credit. Overall, 82.3% currently hold debt and 17.7% report no debts. The market is clearly skewed towards unsecured products, suggesting people are using flexible credit to manage day to day expenses and one off needs.
Personal loans are by far the most common, cited by 61.1% of all respondents. This points to their convenience and wide eligibility. Credit card debt is also prominent at 18.6%, reflecting cards’ dual role as a payment method and short term financing tool. Among secured or longer term products, mortgages sit at 4.4% and car loans at 4.4%, while student loans are reported by 3.5%. A further 17.7% mention other loan types, indicating a tail of specialised or less conventional credit such as overdrafts.
Looking only at those with debt, personal loans are used by 74.2% of borrowers, followed by credit cards 22.6%, other loans 21.5%, mortgages 5.4%, car loans 5.4%, and student loans 4.3%. Most borrowers hold a single product, but multi product use is not rare. 74.2% of borrowers have one product, 19.4% have two, 5.4% have three, and 1.1% carry four, for an average of 1.33 products per borrower. The most common pattern is a personal loan only, followed by a personal loan plus credit card.
The overall incidence of debt remains stable, with about 81% of respondents holding debt in 2024 (19% with none) and 82.3% in 2025 (17.7% with none). However, borrowing patterns have shifted noticeably. Personal loans increased from 37.0% in 2024 to 61.1% in 2025, while “other” loans rose from 10.0% to 17.7%, suggesting that more households are relying on flexible, unsecured credit to manage cash flow, consolidate debt, or cover specific needs. In contrast, mortgages declined from 18.0% to 4.4%, and car loans dropped from 12.0% to 4.4%, indicating fewer people taking on secured or large-scale borrowing, likely due to tighter affordability, deposit barriers, or postponed purchases. Credit card debt also decreased from 25.0% to 18.6%, possibly reflecting a move from revolving credit towards fixed-term personal loans.
In 2025, most borrowers hold only one type of credit product (about 74%), averaging 1.33 products each, with the most common being a personal loan alone. Combined with this year’s intention data where many respondents say they would consider a personal loan for debt consolidation or unexpected expenses, the findings suggest that credit is being used mainly as a tool for financial stability, rather than for discretionary spending or lifestyle upgrades.
How Willing Are Consumers to Take Out Personal Loans in the Next Year?
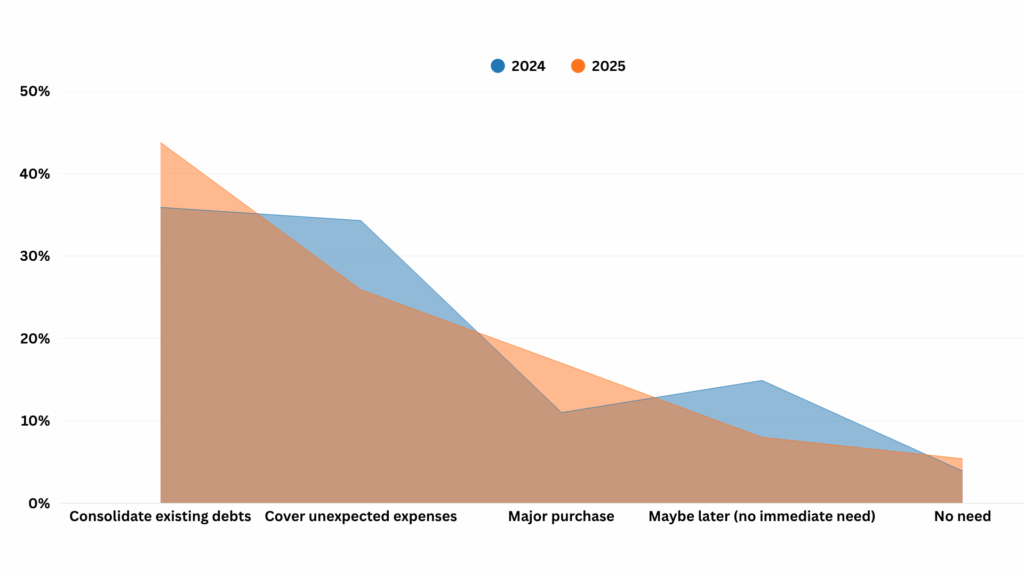
Most respondents are leaning towards borrowing, and mainly for defensive reasons. Out of 112 answers, 86.6% say they have considered a personal loan. The leading motive is debt consolidation (43.8%), followed by covering unexpected expenses (25.9%), with a smaller percentage citing a major purchase (17.0%). Put simply, around half of those considering a loan would use it to combine and manage existing debts, while about three in ten would use it as a buffer for emergencies, and roughly one in five would finance a larger item.
Only 13.4% are not looking at a personal loan right now, split between “no, but maybe later” (8.0%) and “no need” (5.4%). Among those who have considered borrowing, the pattern suggests credit is being used primarily to stabilise finances rather than to stretch lifestyles. This points to ongoing pressure on household budgets, with loans seen as a tool to simplify repayments, smooth shocks, and create a bit of breathing room.
People’s reasons for borrowing have changed since last year. Fewer are looking for loans to cover sudden emergencies, while more are planning ahead to consolidate debt or make big purchases. Debt consolidation has become the top reason for taking out a loan, rising by almost 8 percentage points, and borrowing for major purchases is also up. Meanwhile, fewer people are unsure about borrowing, and a small increase say they simply don’t need a loan right now.
Overall, more people in 2025 have a clear purpose for borrowing, with about 87% ready to take out a loan for a specific reason. When including those who might borrow later, openness to credit remains very high at around 95%. In short, borrowers this year seem more confident and intentional, viewing loans as a way to organise their finances or plan ahead, rather than a last-minute solution for financial emergencies.
By combining your debts into one manageable payment, you can reduce financial stress and even lower your overall interest rate. Learn more about what debt consolidation can do for you and decide if it’s the right choice for your financial future.
Respondents’ Main Criteria for Taking Out a Loan
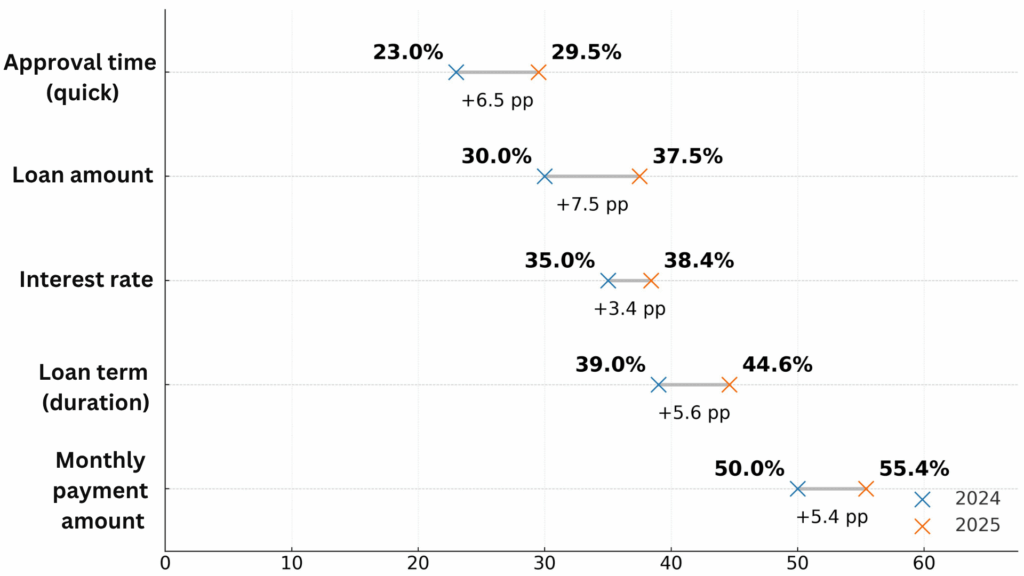
Affordability comes first by a long way. The top criteria were monthly payment amount (55.4%), loan term or duration (44.6%), interest rate or loan price (38.4%), and loan amount (37.5%). Speed and ease sit in the next tier, with approval time (29.5%) and how easy the application is (26.8%). Cost add-ons also matter, with fees and charges (25.0%) flagged by a quarter of respondents. Trust signals are less frequently selected but still visible: lender’s reputation (17.9%), quality of customer service (10.7%), recommendations or reviews (8.0%), and previous experiences with the lender (5.4%). Country of origin (6.2%) is a minor consideration for most.
Grouping the choices shows how strongly people focus on the numbers. 93.8% picked at least one affordability factor, 38.4% chose at least one speed or ease factor, and 24.1% selected at least one trust or service factor. On average, respondents picked about three criteria each, so most people balance a few priorities, but the clear takeaway is simple. Keep the monthly instalment manageable, make the term sensible, keep the rate and fees low, and approve quickly with a fuss-free application. Everything else is secondary for most borrowers.
Borrowers in 2025 are more focused than ever on affordability when choosing a loan. Compared with last year, more people now pay close attention to monthly repayments, loan terms, interest rates, and loan amounts, showing a stronger desire to keep costs predictable and manageable. Quick approval also matters more this year, suggesting borrowers want both affordability and efficiency. Simply put, keeping instalments within budget remains the top priority, and the gap between cost-related factors and everything else has widened.
Other considerations, like how fast or easy the application is and extra fees or charges, form a clear second tier of importance. Meanwhile, factors such as lender reputation, customer service, or brand familiarity play a smaller role. Most respondents selected around three factors overall, meaning people are still weighing a few key points, but for most South Africans in 2025, a loan has to be affordable first, easy second, and everything else is just a bonus.
Dreaming of better loan terms or greater financial flexibility? Your credit score holds the key! Discover practical tips to boost your score, avoid common pitfalls, and unlock the best deals with our guide on how to improve your credit score.
About Arcadia Finance
Arcadia Finance makes securing your loan simple and stress-free. Explore options from 19 reliable lenders, fully accredited by South Africa’s National Credit Regulator. Take advantage of a transparent, fee-free application process designed for your financial goals.
Conclusion
The 2025 Arcadia Finance Survey shows just how much everyday South Africans are feeling the pinch. High prices, steep borrowing costs, and slow salary growth continue to stretch household budgets, leaving many people with little to spare after essentials. Fewer respondents feel satisfied with their finances than a year ago, and confidence in the government’s handling of the economy remains low. Yet, beneath the strain, there’s a clear sense of resilience. Many South Africans are adjusting their budgets, taking on side income, and finding creative ways to keep up with expenses despite the tough environment.
Looking ahead, there’s a glimmer of cautious optimism. More than half of respondents expect a small improvement in their disposable income in the year to come. Personal loans remain a lifeline for many, often used to consolidate debt or handle unexpected costs, and affordability remains the top priority when borrowing. The big takeaway? South Africans are adapting and making smarter financial choices, staying pragmatic, and proving once again that even in uncertain times, determination and financial discipline go a long way.
Fast, uncomplicated, and trustworthy loan comparisons
At Arcadia Finance, you can compare loan offers from multiple lenders with no obligation and free of charge. Get a clear overview of your options and choose the best deal for you.
Fill out our form today to easily compare interest rates from 19 banks and find the right loan for you.