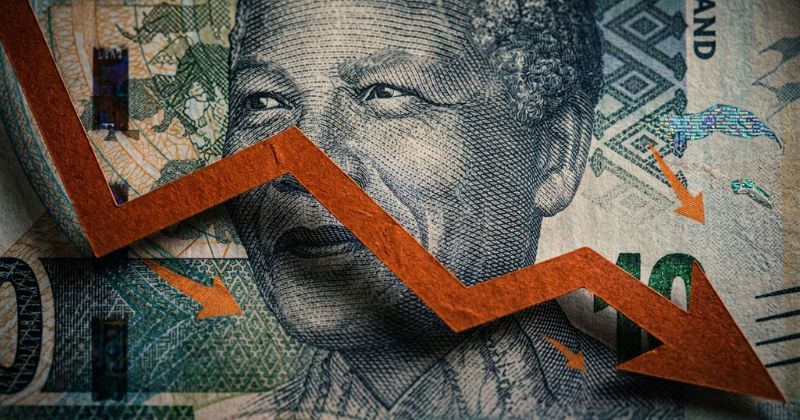
South Africa’s economy has taken a turn for the worse, recording a decline in gross domestic product during the second quarter of 2026, a result that was very much in keeping with what economists and analysts had been anticipating in the lead up to the release of the figures.
Key Takeaways
- GDP contracted in Q2 2026: South Africa’s economy shrank by 0.2% in the second quarter, reversing the 0.4% growth seen in Q1 2026 (itself revised down from 0.5%), largely due to global fallout from the US-Iran war.
- Mining, manufacturing and trade dragged growth down: These three industries posted the sharpest declines (3.0%, 1.8% and 1.9% respectively), while finance, transport, government services and personal services managed modest gains.
- Rising imports outpaced exports: Imports grew 4.9% against export growth of just 0.9%, making net exports the single biggest drag on expenditure-side GDP, even as household spending and government consumption both edged higher.
About Arcadia Finance
Arcadia Finance makes borrowing simple and secure. Compare offers from 19 reputable lenders, all NCR-compliant, with zero application fees. A streamlined process designed to match you with the right loan, every time.
Overview of the Latest Figures
Drawing on the newest data published by Statistics South Africa (Stats SA), the country’s gross domestic product fell by 0.2% in the second quarter of the year, a reversal that comes hard on the heels of the 0.4% growth recorded in the first quarter, itself a figure that has now been revised downward from the 0.5% that was originally reported at the time.
The outcome was not regarded as a shock to anyone following the data closely, given that it reflects the knock on effects of the United States’ war with Iran, a conflict that first broke out at the end of February and has since worked its way through the global economy in the months that have followed.
South Africa did not manage to escape this fallout unharmed, a fact made all the more unfortunate given that the conflict has effectively brought an end to what had, until this point, been a genuinely encouraging run of economic form for the country.
Stats SA typically releases its quarterly GDP figures roughly six to eight weeks after the end of each quarter, meaning analysts and investors often have to wait some time before they get a full picture of how the economy has actually performed.
A Winning Streak Comes to an End
Prior to this setback, the country had put together six consecutive quarters of economic growth stretching all the way back to the fourth quarter of 2024, a run that culminated in annual growth of 1.1% across the whole of 2025.
Even so, and despite this disappointing contraction in the second quarter of 2026, economists are still forecasting a full year GDP reading of 1.2%, which would represent an improvement of 0.1 of a percentage point compared with 2025, with GDP expected to average 1.7% over the course of the following three years.

Sector by Sector Breakdown
Turning to individual sectors of the economy, Stats SA singled out sharply negative contributions coming from a number of key industries, most notably mining, manufacturing and trade.
Industries That Declined
- Trade, catering and accommodation: This industry decreased by 1.9%, contributing a negative 0.2 of a percentage point to overall growth. Within this sector, decreased economic activity was reported across wholesale trade, motor trade, and food and beverages.
- Manufacturing: This industry decreased by 1.8%, contributing a negative 0.2 of a percentage point. Notably, seven out of the ten manufacturing divisions tracked by Stats SA reported negative growth rates during the quarter.
- Mining and quarrying: This industry decreased by 3.0%, contributing a negative 0.1 of a percentage point. The largest negative contributors within this sector were platinum group metals (PGMs), manganese ore, gold and iron ore.
South Africa is home to roughly 80% of the world’s known platinum group metal reserves, which is why swings in PGM output tend to have an outsized effect on the country’s mining figures and, by extension, its overall GDP.
Industries That Grew
Not every sector suffered during the quarter, and a handful of industries managed to eke out growth despite the turbulence unsettling global markets more broadly.
- Finance, real estate and business services: This industry increased by 0.3%, contributing a positive 0.1 of a percentage point. The main contributors here were financial intermediation, insurance and pension funding, along with other business services.
- Transport, storage and communication: This industry increased by 0.9%, contributing a positive 0.1 of a percentage point, with increased economic activity reported specifically within land transport.
- General government services: This industry increased by 1.0%, contributing a positive 0.1 of a percentage point, an increase that was mainly attributable to a rise in compensation of employees within extra budgetary and higher education institutions, as well as within provincial government.
- Personal services: This industry increased by 0.6%, contributing a positive 0.1 of a percentage point, with increased economic activity reported among community services and other producers.
Quick Reference: Sector Contributions
| Industry | Change (%) | Contribution (Percentage Points) | Direction |
|---|---|---|---|
| Mining and quarrying | -3.0% | -0.1 | Decline |
| Trade, catering and accommodation | -1.9% | -0.2 | Decline |
| Manufacturing | -1.8% | -0.2 | Decline |
| Personal services | +0.6% | +0.1 | Growth |
| Transport, storage and communication | +0.9% | +0.1 | Growth |
| General government services | +1.0% | +0.1 | Growth |
| Finance, real estate and business services | +0.3% | +0.1 | Growth |

Expenditure on GDP
Shifting focus to the expenditure side of the ledger, expenditure on real GDP decreased by 0.2% in the second quarter of 2026, a decline that follows on from an increase of 0.4% that had been recorded in the first quarter of the same year.

Household Spending
Household final consumption expenditure (HFCE) increased by 0.4%, contributing a positive 0.3 of a percentage point to what was, overall, a negative growth outcome for the quarter.
Positive growth rates within this category were reported for services, durable goods and non-durable goods alike.
The main positive contributors to the rise in household final consumption expenditure were expenditures on the following:
- Food and non-alcoholic beverages, which rose by 1.2% and contributed 0.2 of a percentage point
- The ‘other’ category, which rose by 0.6% and contributed 0.1 of a percentage point
- Recreation and culture, which rose by 0.8% and contributed 0.1 of a percentage point
- Health, which rose by 0.7% and contributed 0.1 of a percentage point
By contrast, the negative contributors within household spending were expenditures on housing, water, electricity, gas and other fuels, as well as transport, communication, and clothing and footwear.

Government and Investment Spending
Final consumption expenditure by the general government increased by 0.4%, contributing a positive 0.1 of a percentage point to the overall negative growth figure, an increase that was mainly driven by a rise in the compensation of employees.
Gross fixed capital formation, which reflects the level of investment taking place within the economy, decreased by 0.2%, a development that has been flagged as a significant source of concern among economists and analysts closely monitoring the underlying health of the economy.

Trade Flows
Net exports also weighed on expenditure on GDP, contributing negatively to the tune of 1.1 percentage points.
Exports of goods and services increased by 0.9%, a rise that was largely influenced by increased trade in pearls, precious and semi precious stones and precious metals, chemical products, live animals and products, and paper and articles of paper.
However, imports of goods and services increased at a considerably faster pace of 4.9%, a rise that was largely influenced by increased trade in machinery and electrical equipment, mineral products, chemical products, and artificial resins and plastics.
Conclusion
South Africa’s second-quarter contraction marks a clear break from the steady momentum it had built up since late 2024, and while the downturn was widely expected given the disruption caused by the US-Iran war, it exposes real vulnerabilities in mining, manufacturing and trade that will need to be watched closely. Still, the picture isn’t entirely bleak: resilient household spending, a modest uptick in government consumption, and steady growth in services suggest the economy retains some underlying strength, and economists’ continued expectation of 1.2% growth for the full year points to this quarter being viewed as a setback rather than the start of a longer slide. Much will depend on how quickly investment (gross fixed capital formation) recovers and whether the gap between import and export growth begins to narrow in the quarters ahead.
Fast, uncomplicated, and trustworthy loan comparisons
At Arcadia Finance, you can compare loan offers from multiple lenders with no obligation and free of charge. Get a clear overview of your options and choose the best deal for you.
Fill out our form today to easily compare interest rates from 19 banks and find the right loan for you.